Quick-Start Tool
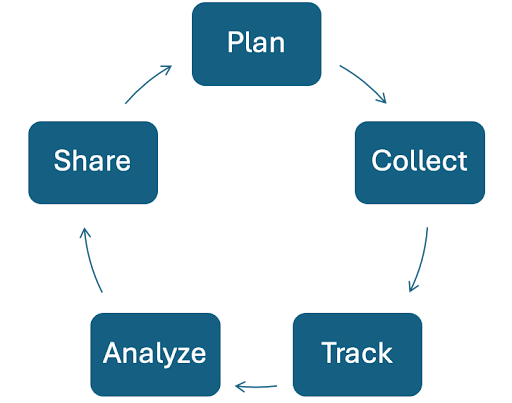
This tool summarizes the strategies outlined in the five step-by-step guides for the Plan, Collect, Track, Analyze, and Share phases of the farmers market evaluation process. Each section references relevant resources and includes a case study related to that particular step. Please refer to the Guides option on the Main Menu for more information on any of these topics or for complete versions of each Guide.
Guide #1: PLAN: Evaluation Planning and Metric Selection
Decide what you want to know; map a plan for collecting this information throughout the year.
Guide #2: COLLECT: Data Collection Methods and Implementation
FMC’s best practices for implementation, plus a collection of tools to help with the process.
Guide #3: TRACK: Data Entry and Management
Integrate into your existing workflows. Note that there is a companion Excel Workbook for this unit.
Guide #4: ANALYZE: Data Analysis and Reporting
Reflect on and analyze the data you have. Identify trends, and then turn your data into metrics and summary reports.
Guide #5: SHARE: Use and Communicate Results
Communicate the data you’ve collected. Offers sample messaging, templates, and best practices using selected indicators and metrics.
Guide 1: Plan
Planning for Data Collection
1. Start with Your Mission
Does your market have a mission? A reason for existing? You might know it intrinsically, or it might be written down formally. Whether formalized or not, a clear articulation of your market’s mission will help you choose metrics, data, and action steps to get you there.
2. Set Goals Related to Your Mission
There are two main reasons to track data as part of working toward your market’s mission. In short, data collection helps with your:
- Operational Objectives
You can measure short-term goals that drive your market to achieve its long-term mission. The data you collect helps you make decisions about organizational operations, do more of what’s working, and course correct if needed. - Communication Objectives
You can measure information that helps you communicate to external audiences, to promote your market, fundraise, and inform stakeholders of its impact.
FMC’s Top Tips
1. Start Small
As much as we love data, FMC advises markets to limit the number of metrics collected, particularly at the start. You might ask: can our staff or volunteers manage and analyze this information? Or, what will we do with this data? We suggest you collect only the data points you have a specific use for, which is why the planning phase is so crucial.
2. Get Familiar With Data Collection Methods
This toolkit groups farmers market data collection methods into three general categories: document review, observation, and surveys. General descriptions of each method are listed below, while other chapters of this toolkit provide templates and recommended best practices.
Document Review
Information about market operations, compiled from market documents. Examples include vendor applications, vendor sales data, vendor attendance, market budgets, and transaction logs from processing government benefits (like SNAP EBT). Much of this is data you are probably already collecting!
Observations
Markets can track information about what happens on market days. Examples include weather, special events, and shopper counts.
Surveys
Collecting information directly from the populations you wish to know more about. Great for discovering opinions or motivations, as well as collecting specific facts and figures. Examples include vendor questionnaires and visitor surveys.
3. Use Common Metrics
FMC recommends a list of “top metrics” which are key to understanding operations at your market. These are good starting points and within reach of markets of all capacities. They include:
- Total market sales
- Total SNAP sales
- Total visitors
- Total volunteer hours contributed
- BIPOC-led enterprises (number and percentage of all vendors)
- Farm vendors (number and percentage of all vendors)
- Acres cultivated by farmers
There is also a collection of additional farmers market metrics available. This resource was developed over years to arrive at the most universal (and useful) language possible. If you’d like to track metrics beyond the “top metrics,” we recommend digging through this resource for our recommendations on metrics language and collection methods. This resource has question wording that you can add directly onto your forms, surveys, and other tools; FMC also has a set of sample tools you can use or adapt.
4. Plan Ahead: Tie Data Collection to Your Workflow
Map Out The Year
Tie data collection efforts to your touchpoints with specific groups throughout the season. Each year, there are times you’ll be interacting with specific groups, and this is a good opportunity to systematize some data collection in these exchanges. Some examples include:
| Market Season Timeline | Collect Data From | Collection Method |
|---|---|---|
| Vendor recruitment | Vendors | Document Review • Vendor application |
| Pre-season marketing | Visitors (or potential visitors) | Survey • Online |
| Fundraising | Funders, Community stakeholders | Survey • Online |
| Peak shopping season | Visitors | Survey • Visitor Intercept |
| End-of-season reporting | Vendors | Document Review • Vendor Attendance • Transaction Logs |
5. Build Your Team
Most managers will likely rely on support staff or volunteers to collect data on a regular basis. To build your team:
- Recruit
Write a job description for your volunteer roles. The best way to ask for help is to be specific in letting people know when, where, and how they can plug in.
Consider recurring versus one-off roles. Recurring volunteer roles are best for data collection you can systematize such as visitor counts, visitor surveys, monitoring vendor attendance, and data entry (both during and after the market). One-off jobs might include supporting a specific data-collection-heavy day, performing data entry and analysis, or creating reports.
Publicize your volunteer opportunities with local schools (secondary and higher education), faith-based organizations, local 4-H clubs, current farmers market customers, and service organizations in your community (like Lions Club, Rotary, etc.). Data collection can be a great role for college students seeking experience for class projects or internships. - Train
Consistent communication with your volunteers is key. Send emails ahead of volunteer shifts that outline expectations. Have someone on-site who can offer volunteer training, hand out supplies, and serve as a point person for questions. - Retain
Let volunteers know how their efforts help your market! Celebrate them! This can be both formal and informal.
Resources
- FMC’s list of common farmers market metrics
- Farmers Market Legal Toolkit: Volunteers at Farmers Markets: Managing Legal Risks
- Oregon State University: Rapid Market Assessment
Case Study: Planning for Data Collection with the Main Street Market
1. Begin With the Mission
The board of directors at Main Street Market defined a three-part mission statement:
- Strengthen the local economy by supporting local farmers and small businesses.
- Provide access to farm-fresh, affordable food to families in the community who need it most.
- Provide a vibrant community space for socializing and education.
2. Set Operational Goals
We then identified what activities could take place in service of working toward the organizational goals. These are specific, measurable things the market can do this year (and in future years) to demonstrate meeting its organizational goals.
| Organizational Goal | Operational Goals* |
|---|---|
| Strengthen the local economy by supporting local farmers and small businesses. | • Increase market foot traffic • Increase vendor sales • Track the number and variety of local businesses represented at market |
| Provide access to farm-fresh, affordable food to families in the community who need it most. | • Track the number of vendors accepting SNAP payments • Track the number of SNAP-eligible goods • Increase number of SNAP transactions • Increase volume of SNAP sales |
| Provide a vibrant community space for socializing and education. | • Increase the number and variety of partnerships with local stakeholders • Track the number of educational activities hosted • Track the market’s contribution to a vibrant downtown area |
*To be specific, you might note the time period and the target number, for each of these– such as “Increase market foot traffic 20% over last season”.
3. Align Data Collection and Operational Goals
Given the operational goals in the table above, we know what metrics we’ll need to track throughout the year. The table below lists each metric alongside the data collection method we’ll use to collect and track it over time.
| Operational Goal / Metrics to Track | Data Collection Method |
|---|---|
| Increase market foot traffic | Observation • Visitor counts |
| Increase vendor sales | Document Review • Transaction logs • Vendor sales slips |
| Track the number and variety of local businesses represented at market | Document Review • Daily market logs |
| Track the number of vendors accepting SNAP payments | Document Review • Transaction logs • Vendor applications |
| Track the number of SNAP-eligible goods | Observation • Rapid Market Assessment |
| Increase number of SNAP transactions | Document Review • Transaction logs |
| Increase volume of SNAP sales | Document Review • Transaction logs |
| Increase the number and variety of partnerships with local stakeholders | Document Review • Daily market logs |
| Track the number of educational activities hosted | Document Review • Daily market logs |
| Track the market’s contribution to a vibrant downtown area | Surveys • Visitor intercept surveys |
3. Tie Data Collection to Workflow
Map Out the Year, tying data collection efforts to specific touchpoints during the market season.
| Market Season Timeline | Associated Operational Goal(s) | Data Collection & Analysis Notes |
|---|---|---|
| Vendor recruitment (January to April) | • Track the number of vendors accepting SNAP payments | Add a question to the vendor application to determine whether vendor will accept SNAP |
| Peak shopping season (May to September) | • Increase market foot traffic • Increase vendor sales • Track the number and variety of local businesses represented at market • Track the number of vendors accepting SNAP payments • Track the number of SNAP-eligible goods • Increase number of SNAP transactions • Track the number of educational activities hosted • Track the market’s contribution to a vibrant downtown area | 1. Plan dates for: • Visitor counts • Rapid Market Assessment • Visitor intercept surveys Recruit volunteers to support these efforts. 2. Plan a system to keep detailed records on the following. Train market staff/volunteers to adhere to system for tracking: • Vendor attendance • Transactions • Daily market logs |
| End-of-season reporting (October to November) | All market goals | Assign deadlines and support staff or volunteers to: 1. Compile data from the season 2. Analyze 3. Report on progress (to board, to public, etc.) |
In the Case Study for Guide 2, we will demonstrate how Main Street Market puts this plan into action and uses FMC’s best practices and templates to help
Guide 2: Collect
Types of Data Collection
Document Review
- Operations Documents
Information about market operations, compiled from market documents. Examples include vendor applications, vendor sales data, vendor attendance, market budgets, and transaction logs from processing government benefits (like SNAP-EBT). - Secondary Data
Information that has already been collected, analyzed, and published elsewhere. Secondary data allows you to compare your market community to other communities in your state, region, or even nationally. Examples include USDA’s Census of Agriculture, the American Community Survey, and published reports from organizations such as United Way or University Extension.
Observations
Markets can track information about what happens on market days. Examples include weather, special events, and visitor counts. These observations would be written on a Market Daily Report or similar tool.
Surveys
Collecting information directly from the populations you wish to know more about. Great for discovering opinions or motivations, as well as collecting specific facts and figures. Examples include vendor questionnaires and visitor surveys.
Three Principles of Data Collection
1. Consistent Method
If you want to compare data over time, Each time you collect information, be sure you’re using consistent methods. If you want to track a data point over time, you’ll need to collect it using the same method each time. For example, suppose you want to compare the number of vendors in each category who sold at your market from one season to the next. You should have a consistent method for categorizing vendors. Write down this definition (for yourself and future staff), keep track of it, and adhere to the same method each time, as much as possible. Using our example, you might consider:
- Do I count everyone on my vendor roster, even if someone sold for just one week?
- Do I count community booths in addition to vendors?
- If vendors sell multiple products, how will I decide what category they fit into?
2. Consistent Data
Remember, you must collect exactly the same information for each time period you wish to compare. As time passes, you might collect or store it in different ways; this is fine, as long as you collect the same information for each time period.
3. Trends Over Time
Once you have the same data for two or more of the same time periods (for example, market day, season, or year), you can create trend reports, comparing those periods. Collect data at the smallest time period you want to compare. For example, if you want to compare market days to each other, collect the same information each market day. If comparing information monthly or annually suffices, track at that level instead.
FMC’s Top Tips
Remember, you must collect exactly the same information for each time period you wish to compare.
In many cases, data collection can be tied to daily market operations. You already collect information each market day to keep operations running; systematizing this data collection can help you stay organized. And with the help of additional staff or volunteers, you can do a “data collection push” a few times per market season, creating deeper insights into your market’s impact.
The tables below recommend schedules and provide FMC-generated templates to get you started.
Every Market Day
| Category | Example Metrics to Report | Instruments / Methods |
|---|---|---|
| Vendor attendance | • Average vendors per day • Average vendors per category • Total vendors supported by the market in a season | • Vendor attendance sheet |
| Vendor sales slips (may be collected anonymously) Central terminal disbursements and sales | • Average vendor sales • Average sales by product category • Total market sales by payment method | • Vendor sales slip • Food assistance transaction record |
| Volunteer contributions Event attendance Number and type of events | • Total number of volunteers • Total number of volunteer hours • Total educational events hosted | • Market day report |
A Few Times Per Market Season
FMC recommends the following information be collected at least two market days each season (these days are in bold in the table below); ideally, markets with capacity should collect this information on four market days. The recommended schedule is based on a 25-week market season.
| Category | Example Metrics to Report | Instruments / Methods |
|---|---|---|
| Visitor count | • Average visitors per day • Time of year (and time of day) market is busiest and slowest • Average visitors per season | • Visitor count template • The 4th, 10th, 16th, and 22nd market days |
| Visitor survey | • Distance traveled to market • Amount spent at market • Amount spent at neighboring businesses | • Customer intercept survey (there are different types, but the most popular is a “dot survey”) • The 5th, 11th, 17th, and 23rd market days |
| Observations & tallies | • Number and variety of products • Number of SNAP-eligible products | • Number and variety of products sold • The 6th, 12th, 18th, and 24th market days |
Once Per Market Season
| Category | Example Metrics to Report | Instruments / Methods |
|---|---|---|
| Vendor profiles | • Average distance traveled from production site to market • Number of new or beginning farmers • Number of women- or minority-owned businesses • Number of people employed by businesses | • Vendor Application Template |
Resources
Market Data Collection
- Electronic Transaction Report
- Vendor Application
- Volunteer Log
- Visitor Count Recording Sheet
- Product Checklist
- Vendor Sales Slip
- Vendor Survey
- Visitor Intercept Survey
- Dot Survey
Secondary Data Sources
Case Study: Collecting Data with the Main Street Market
In Guide 1, the Main Street Market planned data collection for the year. The sections below explain who was involved and what tools and templates they used to get the job done.
Every Market Day
Market-day staff and volunteers completed a daily market log in which they tracked:
- Vendor attendance by type (farmer, baker, etc)
- Vendor sales
- Central terminal (food assistance) sales and vendor reimbursements
- Volunteer support (number of volunteers, hours spent)
- Special events
- Weather
A Few Times Per Market Season
Main Street Market planned additional data collection days throughout the season. The market manager wrote a job description and recruited volunteers from local service organizations. In each case, the market manager communicated details of the volunteer shift and responsibilities ahead of time and was on-site to train volunteers and provide them with needed materials.
Visitor Counts
The market manager recruited four local high school students in need of volunteer hours for the National Honor Society. They counted visitors on the 10th and 16th market days. They received instructions for conducting visitor counts, and clickers to conduct the counts.
Visitor Survey
The market manager recruited four volunteers from the local Rotary Club, who will conduct visitor surveys on the 11th and 17th market days. The market manager also decided to do a dot survey, since this is a fun way to engage shoppers at the market.
Ahead of time, the manager wrote survey questions on large poster boards, leaving room for visitors to place stickers near their answers. The manager used three questions that related back to goals for the season:
- How far did you travel to get to the market today?
- How much did you (or do you plan to) spend at the market today?
- How much did you (or do you plan to) spend at other businesses in the area today?
The fourth question is one that the volunteers ask (and record responses to) as they administer the dot survey:
- Were there any products you wanted but couldn’t find at the market today?
Product Tallies
The market manager used the market’s social media account to recruit two volunteers willing to tally the variety of products available at market on the 12th and 18th days. Volunteers received a product tally sheet, and recorded the number and variety of products available to shoppers that day.
Once Per Market Season
During the off-season while recruiting vendors for the upcoming year, the market manager learned the following from the vendor application:
- How many miles the vendors traveled from production site to market
- What product category (or categories) the vendors sold
Guide 3: Track
FMC’s Top Tips
Check Data Quality
This is a great place to use volunteer or staff time outside of market hours. Each time you collect information, ask:
- Does this information look complete?
- Is there a possibility any of this was transposed or written incorrectly?
- Are there responses that look far outside the “norm?”
- Is this information saved in a safe place where it won’t get lost?
- An easy tip for any information recorded on paper– at the end of the market day, take a photo of the form/document, so that in case it is lost, rained on, or blows away, the information can be retrieved!
Use FMC’s Sample Workbook
FMC has built a sample workbook in Excel which allows users to track common farmers market metrics. The document has features that automatically sum and sort data entered each market day.
Automate Where Possible
Market Management Software
Market management software is becoming more popular. Manage My Market, MarketWurks, Marketspread, and others offer features such as vendor management and invoicing. These platforms allow you to track some of the data you want, then export it into spreadsheet formats.
Survey Forms
This toolkit is full of templates to help you, but this doesn’t mean all data tracking needs to be done by hand. Using online survey software (some of which is free, such as Google Forms), you can build questionnaires for frequently used data collection forms. This will allow market managers or volunteers to track the data you want in real time at the market, ensuring you’re tracking information the same way every time. Or, if paper forms are still the most reliable on market day, you can use staff or volunteer time after the market to translate this from paper into an online form or spreadsheet.
Resources
- FMC’s Data Entry Workbook
- Electronic Transaction Report
- Vendor Application
- Volunteer Log
- Visitor Count Recording Sheet
- Product Checklist
- Vendor Sales Slip
- Vendor Survey
- Visitor Intercept Survey
Guide 4: Analyze
FMC’s Top Tips
1. Start With a Summary
Write a summary, as a way to keep track of where you’ve been. This can be as simple as a few sentences that detail:
- What does this information tell us?
- How did we collect it?
- What specific survey questions or forms did we use to collect it?
- What other information is helpful to know about the process?
This will help you follow the same process (or make improvements to it) in the future, and will help your credibility.
2. Consider Your Reasons for Analyzing
To Guide Operations: Lessons learned from data collection might help you determine next best steps to take. Decisions grounded in data collection can give you confidence to make a change, and can demonstrate to decision makers at your market that changes are grounded in feedback you received.
To Share Externally: Your analysis might also be used for marketing and promotion purposes, to funders, sponsors, or potential customers.
3. Revisit Often
Think of “analysis” as a constant process of reviewing and making plans based on what you learn. You might want to keep a “summary” document where you track your learnings from different data collection efforts. This could be an internal document that helps you retrace your steps as you make decisions.
Case Study: Main Street Farmers Market Analyzes Data
As information comes in, the Main Street Market revisits its Organizational and Operational goals, then analyzes data collected to demonstrate progress toward those goals.
The manager writes a summary report, which is a simple table describing what they discovered, and how it relates back to their goals for the year. Two examples are below.
| Our organizational goal was… | Strengthen the local economy by supporting local farmers and small businesses. |
| An operational goal related to this was… | Track the number and variety of local businesses represented at market |
| So we… | • Took vendor attendance every day, and categorized vendors based on product type • Asked customers (during customer intercept surveys) whether they were searching for products they couldn’t find on market day |
| And we discovered that… | • 40% of our vendors this year sold craft and personal care items • 20% of our vendors sold produce • Visitors said they were wanting a wider variety of produce |
| Here’s what we’ll do with that information: | What we learned from this will help us make an operational decision: we’ll recruit produce vendors over the winter! |
| Our organizational goal was… | Provide a vibrant community space for socializing and education. |
| An operational goal related to this was… | Track the market’s contribution to a vibrant downtown area |
| So we… | • Asked the following questions (during customer intercept surveys): How much did you (or do you plan to) spend at other businesses in the area today? • Tracked the foot traffic at market using FMC’s recommended visitor count method |
| And we discovered that… | • 1700 visitors come to the market each day • 59% visit area businesses • Those who visit spend, on average, $30 at area businesses • Using these numbers, we estimate that: 1,003 shoppers visit area businesses, and spend a combined $34,000 in the area. |
| Here’s what we’ll do with that information: | This is great marketing for our downtown shopping district! We’re hoping this will help us partner with area businesses for a more vibrant downtown area. We’ll also ask area businesses to help promote our market. |
Guide 5: Share
FMC’s Top Tips
1. Start with Your Organizational Goals
This Guide explains how to create a communication plan based on the metrics you have identified as relevant and useful to your market. In previous units, you’ve determined your organizational and operational goals, put great effort into collecting information on your market, and have accumulated valuable data. So, what’s next? It’s time to turn your data into messages that will promote your market.
The audiences you target, messages you promote, and channels you use to distribute your messages all form your communication goals. Maybe your market even has a written communication or outreach plan. These three elements work together to achieve your market’s goals by effectively communicating a specific message to the right people.
Support an Organizational Goal: Your messaging should point back to your market’s goals, and reasons for existing. For example, one of your market’s goals is to support a vibrant local business sector.
2. Know Your Audience
Who you choose to target with your message should correlate with your market’s objectives. Your audiences might include groups of regular shoppers and supporters; they might also include groups you haven’t yet reached but would like to. A target audience will help focus your message and engage the right people.
Target Audience: The people you need to engage to achieve your goals. For example, area businesses.
However, it’s not enough to define your audience as area businesses, for example. You will need to identify subgroups as well.
Segment Group: Subgroup of a broad target audience that share common interests, needs, and motivations. For example, business owners in the immediate downtown area where the market is located.
Tailored messages speak to the unique sets of motivations that drive their behavior and choices. A good message appeals to the values of your audience, not the needs of your market. Once you’ve identified your audience, you can identify unique motivations that drive their behavior and choices. These motivations will help you form a message that supports those values, called the benefit exchange: how your audience will benefit from your market.
Benefit Exchange: Why your audience should care and/or how they benefit. For example, farmers markets might increase traffic to area businesses.
Of course, understanding your audience also requires you to consider barriers they may face. These are perceptions or realities that keep your audience from the actions you want them to take.
Barriers: Perceptions or realities that keep your audience from the actions you want them to take. For example, worry that the market will draw customers away from their business.
3. Create Your Messages
Speak to Motivations
Now that you’ve identified your audience and understand what motivates them, lead with these core values and motivations.
Motivations: Given all the information we know about this audience, what will cause them to listen? For example, area business owners want to be part of a vibrant downtown business district.
Use Your Data
Determine what information, if any, your market collects or tracks, and how it might speak to your audience’s needs.
Use Your Data: What information do you have about your market that speaks directly to what your audience wants? For example, you learned in visitor intercept surveys that shoppers plan to spend an average of $75 at nearby businesses.
End with a Call to Action
All messages must end with a clear call to action or next step, which can be direct (volunteer today!) or more suggestive (tell a friend!).
Call to Action: What specific action do you want the audience to take? For example, ask neighboring businesses to hand out promotional flyers for the market.
Other calls to action might include:
- Feed your family with fresh food from market
- Spend your SNAP benefits with market farmers and vendors
- Learn about the benefits of shopping at market
- Attend a market event or workshop
- Subscribe to your newsletter
- Become a sponsor or donor
- Collaborate on an upcoming project
- Follow your market on social media
- Share a story with a friend
4. Choose Your Channel
Different audiences use different channels; this varies by demographic and whether you seek to engage individuals or organizations. Be sure to choose channels that engage your audience on a regular basis.
Some examples of channels are:
- e-Newsletter
- Direct email
- Social media (Facebook, Twitter, Instagram, Pinterest, etc)
- Print/Broadcast media
- Workshop
- Brochure
- Press release
- Event
- Website
- Person-to-person
5. Plan Ahead
Content Calendars
To create a strong and effective communication plan, it is very important to keep a record of woh, what, when, where and how you target your message. A content calendar is a tool you can use to help plan a strategy for message dissemination, and track the efficacy of each message and channel.
Content calendars come in various forms depending on your need. Simply typing the keywords “content calendar” into an online search engine, such as Google, results in an assortment of free, pre-made calendars. You may also choose to use an online content calendar as a way to easily share, edit, and view with multiple people.
Boilerplate Language
When sharing information on your market, follow this important rule: “Write once and publish often.” This strategy encourages distribution of the same content over multiple forms of media. Market data should be used as often as possible, even in email signatures and website home pages.
6. Review, Review, Review
Before sharing information publicly, be sure to have multiple people review it. In the rush to share, it’s easy to overlook basic errors, and once data is released, correcting it is challenging. Take the time to have someone review and internal notes and anything you plan to share externally.
7. Share A Beautiful Report
Use your data to create a report that’s visually appealing and easy to read! Many free tools do the heavy lifting for you. The table below lists some of our favorite tools that offer templates, photographs, and design elements you can use in external reporting.
| Tool | Good for |
|---|---|
| Canva | Social media visuals; document templates; infographics |
| Coolors | Design elements |
| IconsDB | Design elements |
| Infogr.am | Data visualization; mapping; social media visuals |
| Piktochart | Design templates; infographics; videos |
| The Noun Project | Design elements |
| Unsplash | Photographs |
| Venngage | Infographics; data visualization |
| Template.net | Document templates; design templates |
| MapChart | Mapping |
Resources
- Sample communications language from FMC National Farmers Market Week Toolkit
Case Study: Main Street Market Communications
1. Start with Your Organizational Goals
Recall from Guide 1 that the Main Street Market had the following organizational goals:
- Strengthen the local economy by supporting local farmers and small businesses.
- Provide access to farm-fresh, affordable food to families in the community who need it most.
- Provide a vibrant community space for socializing and education.
Main Street Market has two communication goals, both in alignment with goal (1) listed above. In the coming sections, we will demonstrate how the market uses this goal to communicate with its audiences.
2. Know Your Audience
| Organizational Goal | Strengthen the local economy by supporting local farmers and small businesses. | |
| Operational Goals | Recruit at least three new produce vendors for next season. | Ask neighborhood businesses to advertise our market |
| Target Audience | Potential produce vendors | Business owners |
| Segment Group | Produce growers in 50-mile radius from market | Business owners in 1-mile radius from market |
| Benefit Exchange | Produce growers can sell their products directly to customers | Area business owners may see increased foot traffic on market days |
| Barriers | Produce growers might believe coming to the market won’t be worth their time and money | Area business owners might believe the market takes visitors from their shops. |
3. Create Your Messages
| Start with Motivations | Produce growers want to find new outlets to sell their products | Area business owners want increased foot traffic to their businesses |
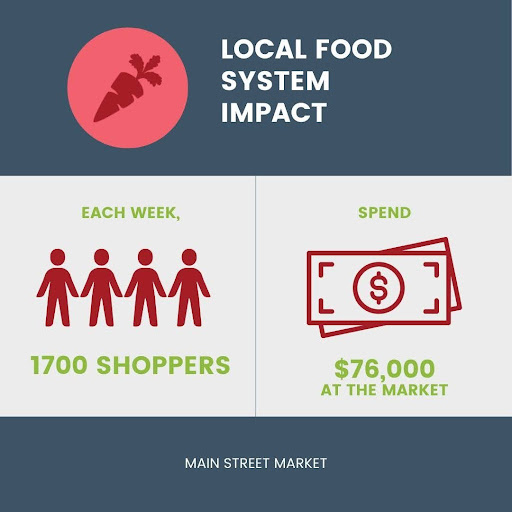
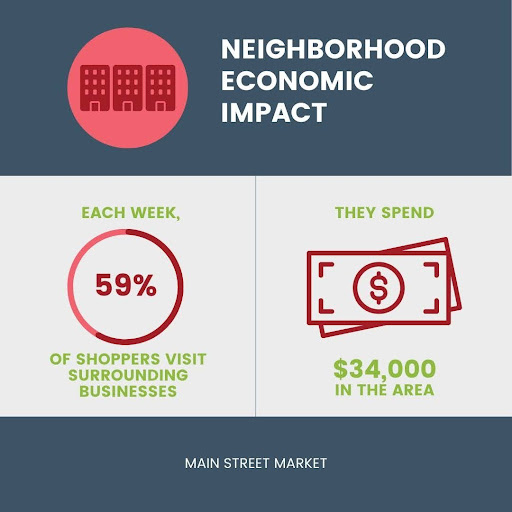
| Use Your Data In this example, all data is taken from visitor intercept surveys, performed 4 times throughout the season. | Shoppers spend, on average, $45 at the market The market has, on average, 1,700 visitors per day | 59% of shoppers visit surrounding businesses Those shoppers spend, on average, $35 at those surrounding businesses |
| Calculate Your Data | On an average market day, 1,700 shoppers spend $45 each. We can estimate about $76,000 is spent each market day. | On an average market day, 59% (1,003) of the 1,700 shoppers spend $35 each at surrounding businesses. We can estimate shoppers spend a total of $34,000 in the area each market day. |
| End with a Call to Action | Apply to be a vendor today! | Help us maintain a vibrant downtown: will you promote our market? |
4. Choose Your Channel
The market has clear messaging and calls to action; now it’s time to reach out publicly. Messaging efforts will target different channels for different audiences:
Produce Growers
Social media: Main Street Market’s social media channels, along with a link to the vendor application and a request to share with friends and family.
Calling all produce growers: If you’re looking for a new sales outlet, consider the Main Street Market. Saturday mornings are bustling: about 1,700 people move through the market each day, spending a total of $76,000. Apply to be a vendor today! Applications open through February 28.
Current Mailing List: Staff will circulate the messaging and call to action to a group that includes current vendors and shoppers.
Do you grow produce (or know someone who does)? The Main Street Market might be the perfect new sales outlet! On an average market day, 1,700 people pass through and vendors collectively bring in $76,000. Apply to be a vendor today, or share this link with someone you know. Applications open through February 28.
Local Extension Agency: Main Street Market staff will circulate copies of an ad (print and digital), asking Extension staff to pass along to any produce growers they encounter.
Area Businesses
Email Ask: Main Street Market will send an email to area businesses asking if they would be willing to place flyers for the market in their shops.
Dear neighbors,
We are proud to be a part of a thriving downtown business district. Saturday mornings are especially busy, and this is good business for all of us! We know that over half (59%) the shoppers at our market wander to nearby businesses; they say they spend, on average, $35 when they do. We estimate that each market day, our shoppers spend $34,000 with area businesses like you!
This tells us that cross-promotion is critical: when one of us thrives, we all thrive. Will you consider placing flyers for our market at your cash register or some other visible area of your business? We have marketing materials we could drop off any time you’d like.
Please let us know what, if anything, we can do to support you as well. Thanks for considering!
Best,
The Main Street Market team
Social media: Main Street Market’s social media channels will post the following message, tagging as many area businesses as possible.
Main Street Market contributes to a vibrant downtown area! Over half our shoppers visit nearby businesses on market days. We’re proud to support our friends nearby!
Conclusion
This “Quick Start” guide has given you FMC’s top recommendations on the farmers market evaluation process, as well as examples of these practices in action. If you’d like to dig deeper, check out our Resource Library and long-form evaluation Guides.