Guide #1: PLAN
Evaluation Planning and Metric Selection
Decide what you want to know; map a plan for collecting this information throughout the year.
This unit explains how to decide what you want to know– along with who wants to know it, and for what reason (e.g. …to make market management decisions? …to show impact of the market to a funder?)– and then select metrics that will help you find out these things. FMC recommends that markets initially select a limited set of metrics to start with, making data collection doable and within reach of markets of all capacity levels. This is the second in a series of six units within the Farmers Market evaluation guides.
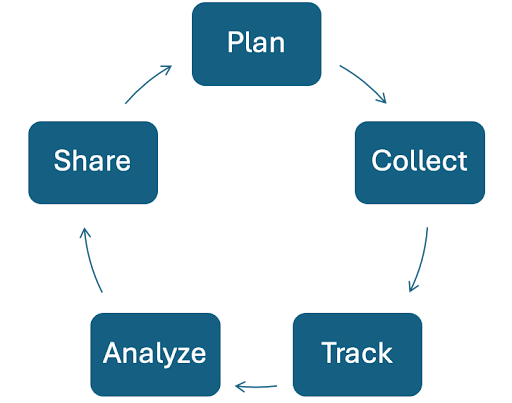
Evaluation is a cyclical process. It is not just done at the end of the season, but includes tracking data from before the season even begins (vendor applications have a lot of valuable data!) and then throughout the season. The cycle of evaluation will evolve over time.
Choosing Metrics– i.e. What do you want to know?
When choosing metrics, begin by examining the goals of your market or goals for a specific project. Next, identify the audience(s) that will assist your market in meeting those goals. Don’t collect data “just in case” you need it.
In many cases, a market’s mission statement provides an outline with which to begin. Let’s say that your mission highlights supporting regional producers: in that case, selecting the metrics Average distance in miles traveled from farm to market and Total agricultural acres owned or managed by market vendors would be most helpful to measure the success of that goal.
Most markets spend a great deal of their energy and time communicating with audiences that already support the market. While it is important to appreciate existing supporters, it is also essential to reach those who are ambivalent or unaware of the market in their community. A disciplined evaluation project speaks the same language to many audiences, no matter how much they already know about how markets work.
One way to assess whether your market is “preaching to the choir” is to consider how and where it communicates with its audiences. If Facebook and other social media sites are your chief avenues of communication, then your market is likely only updating current shoppers and existing stakeholders. If the market’s website is the main place news is shared, the market is sharing information primarily with strong supporters.
Both of those are a good use of management time, but what about new supporters who are less familiar with the history of the market or about farmers markets in general? What about funders that don’t normally fund food system work but are interested in tackling food insecurity and supporting farmers?
An in-depth market evaluation project will measure impacts on as many audiences as necessary, keeping in mind the time and effort it will take to collect and analyze that data. Choosing the right metrics for your market means first thinking about how many groups of unique audiences can be found within your market community: experienced vendors, regular shoppers, new shoppers, benefit program shoppers (i.e., SNAP or WIC recipients), Main Street business neighbors, and other populations.
Here’s an example of choosing a metric that will help guide a marketing strategy:
Market A wants to promote the number of products available on a single market day. By using data collected from vendors on their products with the metric number of different fruits and vegetable crops available for sale on the annual application, the market can advertise that list of produce when the spring season begins.
Here’s an example of choosing a metric related to sharing information with an identified audience:
Market B is embarking on a funding partnership with city public health agencies to add a cash incentive when visitors use their SNAP card. This project will collect data with two metrics: Number of SNAP transactions and Average number of SNAP-eligible goods per market day. If data is collected before and after the incentive is offered, those two metrics will show if there was any change in sales, and if sales vary based on how many products are at the market. Having that data available to share with the partner agencies will show the effects of the funding and may help support continuation of the program.
Below you’ll see an audience identification exercise in which you will identify those individuals, organizations or communities that support the market; those who do not; and all of those in between. Figure 1.2. presents the Audience Identification Exercise. It will aid in the metric selection process.
Exercise: Using individual post it notes, write down as many audiences that your market targets on a regular basis and put them on the graph where they belong. Stand back and look at the clusters and at the less populated areas of this spectrum and discuss extending your outreach to those audiences.
Audiences to consider include specific extension agents, new farmers, anchor vendors, area funders focused on education or ecological issues, print media, statewide farmers market leaders, at-risk residents, neighboring businesses, town leaders.
You’ll learn more about strategies for communicating data to different audiences in Guide #6 (Share).
Systems Impacts
Markets impact various systems, including the economic, social, and ecological dimensions of a community or region. For the purpose of farmers market evaluation, we focus on wealth through the lenses of economic, ecological, social and human systems. Benefits may be direct or indirect as a result of the market’s activities. The recipient can be a vendor, shopper, visitor, neighboring business or even extend to the surrounding region.
This is sometimes referred to as capital and has been used in evaluation systems such as the Ford Foundation’s efforts to measure multiple types of wealth and in Richard Florida’s work to measure creativity in cities. It has also been applied to markets in farmers market research conducted by Market Umbrella and in research by Projects for Public Spaces, among others. This type of framework works well to illustrate the multiple benefits that markets offer to their communities and is a recognizable format to present to market partners.
Systems impacts include:
- Economic identifies financial rewards, including job creation and built infrastructure.
- Social includes social inclusion, bridging and bonding, civic engagement and political participation.
- Ecological presents the conservation or reuse of natural materials, and the restoration and stewardship of the natural world.
A market may want to collect data across all systems impacts and continue to collect the same metrics annually to show the multiple impacts that their market has on its community over time. This is a good strategy for collecting data to present in an annual report or a fundraising letter.
Other Factors to Consider
How much time will it take?
When selecting which metrics to collect data for, consider the amount of time and staffing required to collect, enter, analyze and use the data.
Select a limited set of metrics.
As enthusiastic as FMC is about collecting data, we advise markets to limit the number of metrics it collects, particularly when starting their evaluation journey. You might ask questions such as “Can the market manage and analyze all of this data?” What will we do with this data?
Markets often think they must collect as many metrics as possible in a single data collection season in order for the collection process to be worthwhile. However, it is important to avoid survey burnout among market-goers. Additionally, the manager(s) may become overloaded if he or she needs to recruit too many volunteers. And good data can be used more than once, so do your best to select metrics sparingly and carefully.
In 2014, Farmers Market Coalition began work on a grant funded by USDA’s Agriculture and Food Research Institute in collaboration with the University of Wisconsin-Madison. Indicators for Impact: Farmers Markets as Leaders in Collaborative Food System Data Collection and Analysis is a three-year research project to identify and refine a set of metrics and data collection protocols in order to help market managers and organizers measure their contributions and impacts with their communities.
Read the following quotes from markets participating in the Indicators for Impact project as they describe their process for choosing metrics:
“To determine which metrics to collect, the board of directors and the market manager considered the information shared by the project leaders and then discussed what information would also be helpful in terms of long-term planning for our market. We also want to better understand who our customers are and where they come from.”
“We chose metrics that will be of interest to our stakeholders and Board of Directors, but will not take too much time for our market team.”
“We focused first on the things we could easily collect and then thought about the metrics that would be most useful for us in supporting and expanding the market operations (particularly in terms of getting resources for a regular market manager).”
“Our metric selection gives us the ability to show what fresh, local food is easily accessed at our market, how many people walk or bike to the market, and how the local economy is growing through farming, backyard farming and entrepreneurship.”
Key Takeaways
Deciding what you want to measure and why, and then choosing meaningful and appropriate metrics can provide valuable insight into the market’s operations and impact within the community. The metric selection process requires some reflection on the goals of the market or one of its projects, but will help guide decision-making and program planning over time, and illustrate all of the different ways the market adds value to the community.