Guide #2: COLLECT
Data Collection Methods and Implementation
FMC’s best practices for implementation, plus a collection of tools to help with the process.
Data 101: Primary and Secondary, Quantitative and Qualitative
Now that you have read guide 1, you have selected the metrics that best fit your farmers market’s goals. Next, you need to think about the specific data that will be collected. When you count visitors, collect sales totals, or record volunteer hours, you are collecting and documenting data.
The goal is to collect data that is reliable and repeatable. You can achieve that goal once you understand the different ways to categorize data and the best methods for collecting those different types of data.
Primary and Secondary Data
Market managers, volunteers, and organizers may not think of themselves as “data collectors.” Nonetheless, you are likely already doing it: when a market counts visitors, collects sales figures, or records volunteer hours, it is collecting and creating primary data. Vendor applications, records of card transactions, and visitor count sheets are all examples of tools that collect primary data.
Secondary data, on the other hand, has already been collected, analyzed, and (usually) published somewhere. Secondary data also allows you to compare your market community to other communities in your state, region, or even nationally. These well regarded sources of secondary data could provide relevant information to your market:the USDA’s Farmers Market Manager Survey (2019 survey results), USDA’s Census of Agriculture (2022 Census results) conducted every five years, the Food Environment Atlas (most recent data from 2018), and the US Census’ American Community Survey (updated annually). Your city or county may also have commissioned studies or a Community Food Assessment which may help you understand demographics, land use, and nutrition assistance participation in your area. In addition, income, consumer spending, and economic multiplier data is available by region from the Bureau of Economic Analysis. The USDA Economic Research Service even has national data on food purchasing trends. You can also look at data from nonprofits such as your local United Way or state Extension, or local data through local, county, or state departments such as community & economic development, public health, agriculture, or human services. And, a search for your community or county in Google Scholar may identify research data published about your community.
Quantitative and Qualitative Data
After primary and secondary data, the next step in categorizing data is either as quantitative or qualitative. An easy way to remember the difference is that quantitative data involves numbers (quantities) that can be compared or measured, while qualitative data contains descriptions (quality) and can only be arranged into categories. Together, they can offer a better picture of a market’s impact.
In this guide, we focus on quantitative metrics, since they are most often required in reports for funders or partners, and because they are more easily collected and analyzed. So it’s a good place to start your data collection, though we’ll talk a bit about qualitative data, too, in case your market has the interest and the capacity to collect and use this data. There are many in-depth resources, including nearby university researchers, available to assist you in learning about and conducting qualitative research when you are ready.
Quantitative data contains numbers: for example, visitors, sales totals, pounds of food donated, days per year all of which can be measured or counted in categories. Because the things being counted are usually physical objects or material, quantitative data tends to be viewed as more objective. Quantitative data lends itself to comparisons over time, such as how many visitors to the market this year compared to last year and the year before. Numbers can be easily reported as ranges or made into percentages, or averages.
But since there is more to markets than just material objects or numbers, you might also want to collect qualitative data. Qualitative data involves open-ended explorations of people’s opinions, experiences, feelings, or understandings or collectors’ observations. Common methods used in qualitative research include structured interviews, participant observation, oral histories, written field notes, and open-ended questions. Qualitative data is especially useful in revealing patterns and relationships, offering context for quantitative data, and digging deeper into opinions that may influence your market’s goals and operations. It is, however, time consuming to collect, code, report, and analyze.
Three Methods for Data Collection at Markets
In this Training Unit we focus on three general methods for collecting data at farmers markets:
- Document Review
- Observation
- Surveys
Examples of how markets currently use these methods include:
- Reviewing documents – vendor sales data, market day documentation, market budgets, logs, or information supplied through processing government benefits such as Farmers Market Nutrition Program or SNAP EBT
- Observations – weather, special events shopper counts, vendor tallies
- Surveys – vendor questionnaires and shopper surveys, including Dot Surveys
These three methods were selected because they are relatively cost-effective, practical, and gather the same information that farmers markets across the country are already collecting.
Collection Schedules
To begin data collection, plan the dates well ahead of time in order to organize the labor and resources needed. Weather or other issues may arise which as the day arrives, may make it seem better to cancel but if it is at all possible, keep that agreed upon date. Alert your vendors and shoppers to the collection dates using the market website, Facebook page and signs at the market leading up to the collection days.
If volunteers are needed, then adding that request to chalked market signs, the market Facebook page and in email newsletters weeks ahead may increase chances of encouraging market enthusiasts to help with collection.
This guide’s instructions are based on markets collecting survey data on a minimum of two days per season, with four days of surveying encouraged whenever possible. The thinking is that markets with an average of a 25 week season need at least two sample days of data and should be able to gather the resources at least twice to do surveys correctly. Year-round markets should also schedule data collection just as a one-season market does, but add more rounds of data collection using the same intervals (i.e. the 10th and 16th market week of the winter season). In other words, don’t think of data collection as never-ending, but as campaigns with a kick off, check-in, and a wrap up at the end of each campaign.
Consider following or adapting the example schedule presented in Figure 2.1 below. The bolded days are the primary days for two days of collection. However, if you have the data collection team available and would like more precise data, the other two dates should be added.
| Counting Days | On the 4th, 10th, 16th and 22nd market days |
| Intercept/Dot Surveys | On the 5th, 11th, 17th and 23rd market days (if unable to conduct on Counting Days) |
| Observation/Tallies | On the 6th, 12th, 18th and 24th market days |
| Ideally surveys should be conducted on the same day as counting visitors. If two seasons of data collection are desired, repeat the dates above for each season. |
Data Collection Instruments
Each of the three general methods is handled using specific kinds of collection instruments (tally form, vendor sales slips, survey). Using the same system every time you collect the same data helps ensure that information collected over time is reliable, repeatable, and can be compared to other data collected at a different time.
Review a summary of common metrics used and the instruments used for collecting data for each metric in Figure 2.2. on the following page. FMC’s complete list of metrics can be found here.
Figure 2.2. Metrics and Methodology Table
| Data to be collected | Metric | Collection Method | Instrument |
|---|---|---|---|
| SNAP transactions by date and number | Number of SNAP transactions | Document Review | SNAP-EBT Transaction Log |
| Number of miles from the vendor’s primary location and the market (one way) | Average distance in miles traveled from farm to market | Document Review | Vendor Application |
| Number of agricultural acres for a given year | Agricultural acres owned or leased by market farmers | Document Review | Vendor Application |
| Number of hours per day per volunteer | Number of volunteer hours contributed | Document Review | Market Day Report, Market Season Summary |
| Estimated number of visitors on a market day | Estimated number of visitors | Observation | Market Day Report, Market Season Summary |
| Number of SNAP-eligible goods on a specific market day | Average number of SNAP-eligible goods available per market day | Observation | Product Inventory |
| Total sales by vendor for market day or by month | Total market sales | Survey | Market Day Report |
| Dollar amount that a shopper spent | Average spending per shopper per visit | Survey | Visitor Survey |
| Respondent counts by mode of transportation | Transportation methods used by market visitors | Survey | Visitor Survey |
Collection Methods
Document Review
Document review includes two types of Market Methods: Operations Research and Secondary Research.
Operations Research makes use of the documents and data usually collected during normal farmers market management activities.
One of your first steps with Operations Research is to take stock of what information your market is already collecting, either for your own use or for any farmers market association, public benefit program (i.e., FMNP, SNAP EBT), grant, or market sponsor. Much of this information is already in your vendor applications and surveys, market day forms or logs used to track vendor fees, vendor attendance, payment processing statements, etc. Hopefully, collecting and storing at least some of this information is already a routine part of your market operations.
As you consider your market operations research, you should:
- Compile a list of all the operational documents your market already has on file.
- Review the documents and inventory all of the information or data that you already have. What’s missing? What would you like to add next season? What condition is the data in? Is it complete, or are there missing variables?
- Modify future market operations documents as needed to ensure you are collecting the information you need.
Organizing your information and making it easy to access are also critical. This observation is especially true when there is a change in the primary market manager or if market information is being stored on personal computers. Once your market’s operations data collection is routine, then your energy can be dedicated to keeping it up-to-date and compiling it in a useful way. Guide 3 will share some best practices for managing the data collected.
Secondary Research uses previously collected data, such as what is found in the Census of Agriculture, which is published every 5 years. If you have a research partner who wants to add data from those reports to your market reporting, certainly encourage them to do so. It will offer your market some comparisons or some context for the data that you collect. Number of market vendors under 35 years old is one such metric that might benefit from secondary data from the Census of Agriculture as the larger data set from the Census could be compared with the market vendor’s data.
Observation
Observation is a way of gathering data by counting people or products, documenting behavior, events, or physical characteristics in their natural setting. Observations can be “overt,” meaning everyone knows they are being observed, or it can be more subtle or “covert,” meaning no one knows they are being observed.
The benefit of covert observation is that people are more likely to behave naturally if they do not know they are being observed. However, covert observation methods raise potential ethical problems that most markets want to avoid. That’s why markets typically only conduct overt observation, often posting a sign informing patrons about a planned observation.
This section covers two types of market methods that are considered Observation:
- counts of people and products;
- photographs and video recording
The advantages of observation methods include:
- Tallies of items like market goods or recipes taken, for example, can be gathered directly by the market staff, volunteers, or the data team, rather than asking vendors to submit data;
- Collectors can note what doesn’t happen, which is also valuable information. “The seating near the event was not used.”
The data from observations can be biased because people usually perform “better” when they know they are being observed. Additionally, unexpected observers with clipboards or audio-visual equipment wandering the market may seem invasive to customers and/or vendors when not informed before collection begins.
Counts of People or Products
Tracking the numbers of market visitors, vendors, and products is critical to knowing how well a farmers market is doing. You need to be able to answer questions such as:
- What are our average sales per shopper?
- On average, how many visitors come to our market? Is it growing? Declining?
- What are the patterns over the market season?
To answer these questions, you need to have good data collected in the same way each time.
First, you must define the category that will be counted. In this training, we recommend choosing “adult visitor” as your category or unit of data. This means any adult visitor entering the market will be counted. Some markets choose to count “anyone with a wallet” (including teenagers). Whatever the category or definition of your unit, make sure you spell it out to your data collectors and in your final report.
The method for counting visitors in this unit is an entry sample, which counts every adult visitor as they enter the market for a series of predetermined time periods. Using the entry sample approach should reduce over- or under-counting by not counting those who might remain in the market through two rounds of counts.
During each twenty-minute phase within an hour, the market will not have precisely the same number of visitors entering. That’s why the numbers you will compute as estimates are just that – an estimate – and they show trends in attendance but not precise attendance numbers.
Some researchers believe that greater accuracy is achieved by counting everyone entering the market, known by some as a full count. If trained staff is available to do a full count, by all means do so – it may generate more precise numbers and make related computations more precise as well. But be aware: the full count may be subject to higher human error, is still a sample of overall attendance if not done every market day, is quite labor intensive, and may be quite difficult to manage for markets with many entrances and large attendance.
When tallying products for metrics such as “Average number of SNAP-eligible goods available per market day” the market needs to be clear with those collecting how to handle duplicates or different varieties of the same product before they begin their data collection. It is also helpful to complete product tallies as early as possible in the market day before some items sell out.
Tips for Implementation
- Avoid conducting a visitor count during the first few market days or the last few market days of the season or on all of the market’s event days. In other words, choose the most representative dates of your season(s). If you have events every market day, be sure to note what was happening on the day of the count.
- Communicate the news about your designated counting or survey Days as early as possible to all members of your farmers market community (vendors, volunteers, board members).
- In the weeks before a counting day, walk through the process of what will happen on those days with vendors. If you are unsure about the process you have set up, consider conducting a trial count on the first or second market day, to give yourself a chance to work out any kinks.
Photographs and Video Recordings
Another way to observe and collect market data is by using audio/visual recordings to capture market day patterns, including traffic flow, and to analyze interactions with vendors. Videos, audio recordings, and photographs allow the researcher or data collection team to re-visit moments and reawaken memories of the market day.
Photography and videography are tools that require both expertise and appropriate technology, including computer software. Recording the market also requires identifying in advance the best locations from which to record or take pictures throughout the market day.
Benefits and limitations
Video recording offers an opportunity to observe and re-observe market gatherings and interactions over and over again. Researchers may be able to observe something in a video that they might have missed in a single viewing. Similarly, recorded interviews with market participants (visitors, shoppers, and vendors) allow the researcher to listen to material more than a single time. Photos capture only a single point in time, but can be a powerful way to illustrate and share data. Both videos and photos are easy to share online or via a website and can be used collaboratively in both research and communications. It is also imperative that the market have permission forms for those being interviewed on camera and signs alerting that recording is happening at all entrances and in the market. Ask a university researcher to assist with crafting the forms.
There are limitations to audio and visual recording, however. Weather, including wind, can influence the quality of results from video and photography or even require rescheduling. Recording tools can be expensive and require safekeeping during market hours. Additionally, because market participants are aware that they are being observed, data collection with a recorder in hand may be disruptive to normal market activity.
Collection Method: Surveys
We focus on three types of surveys that farmers markets often use. They include questionnaires (also called self-administered surveys), intercept (face-to-face) surveys, and dot surveys.
Unlike a census, a survey collects information from a sample of the total population you want to be able to learn something about. Samples can be randomized (asking every second person that walks by), self-selected (having a link to a survey on your Facebook page), or pre-selected (asking all vendors or incentive shoppers to fill one out). Regardless of your selection technique, be sure to note it in your data files, so it is part of your methods.
The size of the sample is also important. There is always a question of how large a sample you need to produce “valid” results.
How sure do you need to be that the answers reflect the views of your population?
This is your margin of error. So if, for example, 90% of your sample likes grape bubble gum, a 5% margin of error would add 5% on either side of that number, meaning that actually 85-95% of your sample likes grape bubble gum. 5% is the most commonly used margin of error, but you may want anywhere from 1-10% for a margin of error depending on your survey. Increasing your margin of error above 10% is not recommended.
How sure do you need to be that the sample accurately samples your population?
This is your confidence level. A confidence level is the likelihood that the sample you picked mattered in the results you got. The calculation is usually done in the following way. If you picked 30 more samples randomly from your population, how often would the results you got in your one sample significantly differ from those other 30 samples? A 95% confidence level means that you would get the same results 95% of the time. 95% is the most commonly used confidence level but you may want a 90% or 99% confidence level depending on your survey. Decreasing your confidence level below 90% is not recommended.
A 5% margin of error and 95% confidence level is the level we chose for this unit. Markets can choose different levels, based on their partners’ and their own analysis needs. As for response rate, this is usually very high for market intercept or Dot surveys, as most of those approached to complete surveys at markets are happy to help. However, if you are surveying outside population (for example, at a community center) or your vendors it may be more difficult to get completed surveys. As a general rule, you will want to set a goal of reaching at least 10-15% of that population.
For all surveys, think through your research question clearly. Keep in mind that yes/no, multiple choice and numeric answers are far more straight-forward to clean, analyze and report.
Three more important tips for conducting successful surveys are listed below:
- Test your final survey with your friends, colleagues, or some other “pilot” group to work out the bugs;
- Keep your surveys as short as possible. This is easier said than done, but short surveys increase your response rates (more people will complete them) and are easier to clean, analyze, and report. Try to keep the entire exchange under 2 minutes; remember, people are there to work or to shop, not to answer dozens of questions. Whenever you are not sure, ask yourself if the added information is necessary to collect that year. Often markets overload their surveys and burn out their collectors and their target population! Keep in mind you can always ask other questions in another round of data collection later.
- In some cases, offering an incentive to respondents can help increase your response rate. At a farmers market, easy incentives include free tokens, free coffee or tea, or even free produce.
Questionnaires/Surveys
A questionnaire or self-administered survey is a useful way to gather data while preserving a degree of privacy.
Written questionnaires can take the form of paper or online questionnaires. If you have current emails for the population you want to survey, an online questionnaire can enable you to collect information from a large number of people in a short period of time and in a cost-effective way.
The results of an online questionnaire can usually be obtained quickly and easily through online services such as Google Forms or Survey Monkey. Be sure to check what each version of software allows; in the free versions, these companies often limit how many responses you can collect and how the data can be exported. These online services also offer paid options for larger samples.
Data obtained through questionnaires does have limitations: some respondents may not recall answers to every question or may not always be truthful. Additionally, questionnaires may not capture all the desired information, depending on the length of and number of questions posed by the researcher.
Many markets are hesitant to ask their vendors sensitive information about sales or other business data, which is a perfectly valid concern. However, since markets are tasked with advocating for their community with policy makers and others, sales data is key. What is important is to safeguard the information and to only ask what and when necessary. Collecting data that is never used for analysis is a waste of everyone’s time and can reduce trust between vendors and the market. Here is one way to collect sales data anonymously:
Tips for Implementation of Vendor Sales Questionnaires
- Some vendors may prefer to simply hand you the folded slip, but make sure they have the ability to insert it themselves unobserved, on their own time.
- Data collectors should make sure each slip is folded in half by the vendor and not “sneak a peek.”
- Place the empty canister at the market information booth, along with the list (or map) taped to the side or immediately next to it, with a pen.
- Distribute the slips to each vendor during the first 30 minutes of the market and remind each vendor to turn in last week’s sales slips to the canister at the market information booth at their earliest convenience. They should check off their name on the list or map next to the canister when they do so.
- Approximately an hour before closing, check the canister and list. For any vendors not checked off, make the rounds with the canister, offering to take their folded slip with last week’s sales data if they haven’t had a chance to leave their booth and submit it themselves. Remember to follow up with any vendors with outstanding slips from prior weeks.
Intercept Surveys
Intercept surveys capture real time information by approaching market visitors on site and inviting them to complete a survey. Intercept surveys may allow the data collector to reach the desired number of surveys quickly over the course of the market day.
Intercept surveys also have some drawbacks:
- Visitors may not like being interrupted in their usual activity at the market.
- Intercept surveys require training of data collectors.
- The market may need to recruit numbers of volunteers or paid data collectors.
- Weather may also be a factor in survey success, since reliable results depend on surveying a relatively large percentage of the shopper population.
Dot Surveys
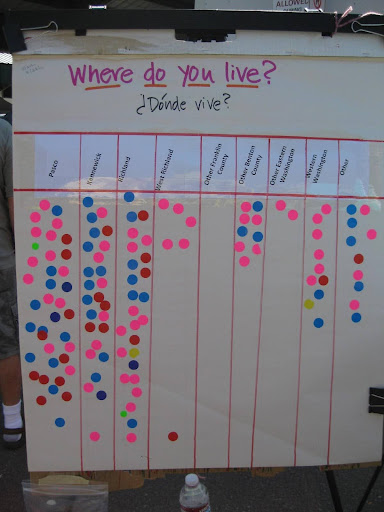
Dot surveys are popular instruments for collecting information from market visitors about simple “yes or no” or multiple choice questions in which only one response is possible. A small number of questions (1-3) are displayed on sheets of paper on easels or flipcharts. Respondents indicate their responses using colorful, stick-on dots during the visit to the market. Dot surveys are a core part of Rapid Market Assessments (RMA), along with shopper counts and constructive comments and observations from the RMA team.
Benefits and Limitations
The benefits of using dot surveys include the fun, interactive atmosphere they contribute to the market and their typically high response rate. The main limitation of dot surveys is the time required to recruit volunteers and figure out the right questions and responses that work well in a dot survey, as well having someone on hand ready to hand out the dots to enough people, and to change the sheets of paper regularly. This type of survey is not appropriate for sensitive or personal data, and like other intercept surveys, may also be negatively impacted by bad weather. Answers can also be influenced by prestige bias, meaning that respondents can be influenced by previous answers clustered in one area.
Examples of two different types of Dot Surveys are presented in Figures 2.3 and 2.4 on the following pages.This photo is an example of a Dot Survey. Notice how the first sheet has one question only and a column for each possible answer.
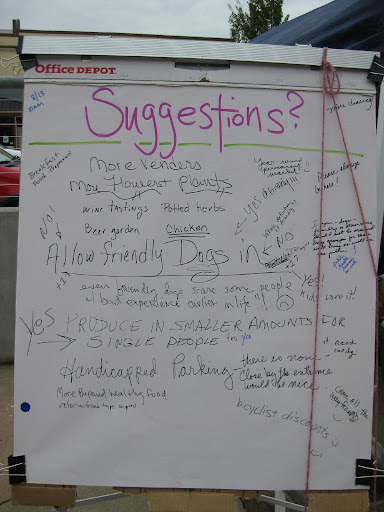
This Dot Survey is an example of capturing qualitative data. However, organizing this into analysis can be difficult as the context of the comments and the demographic information of the person who offered the suggestion are not recorded. Still, it is a friendly way to allow shoppers to offer input on the market.
Additional Tips
For many metrics, data is initially obtained on a paper instrument, whether it’s a physical slip of paper handed in by a vendor at the end of the day, a visitor count tally sheet, or an intercept survey on which members of the data collection team wrote visitor responses using a clipboard as they walked around the market.
Keeping track of all these pieces of paper can itself be challenging, so here are a few tips for keeping track of surveys and tally sheets:
- Make sure the date received is recorded on every data collection form, in the same place on each instrument.
- Assign a unique identifier to each completed instrument, using incremental numbers like 001, 002, 003. Write this number on the corner of each paper survey questionnaire, and enter that same number in the column labeled “ID#” followed by the data for that questionnaire. Later, this will allow members of the research team to find a particular questionnaire even if identifying elements (name or contact information) are removed from your electronic database.
On data collection day:
- Have physical maps of the market on a clipboard or a table in a central location. If there is not a market booth or table normally, it would be helpful to set one up for the day with bins for the data collectors to store their personal items (have them leave expensive items in their car or at home) and to keep water and extra supplies and even chairs for between “shifts” if applicable.
- Start the day of data collection by explaining the breakdown of the day, including sketching out where everyone is to be and at what time each person needs to be there. It might be helpful to write everyone’s name on the map in the location they are assigned with their mobile phone number if applicable. Have everyone introduce themselves.
- When handing the collectors their interview or observation sheets, mark their name and their goal for completion for that hour or the specific time period covered on the top sheet or on a post-it note. Ask them to come back to the booth or arrange to meet them at a specified time at the end of that time period. All collectors should have 5-10 minutes each hour for a break or a 20-30 minute break for those collectors working the entire market day.
- Give everyone a name and a phone number to call if they have an issue, even if that person will be checking in regularly. If possible, introduce them to the vendor nearest to their station.
- At the end of the first collection timespan, ask collectors how things went, ask them to describe one of their data collections, and ask them for any ideas to make it easier or more fluid the next time.
- If there is time, do one or two rounds of role-playing with the market leader acting as the data collector and if possible, a regular volunteer as the respondent.
- Assure the collectors that this will go well and be easy work. Offer some sample language for intercept or dot surveys, such as, “Do you have a minute to help the market?” and give a simple explanation to use when questioned by visitors or vendors, especially for observers and tally collectors, such as, “We’re gathering information to help the market.”
- Assign one person to look through completed surveys and check the tallies throughout the day. Ideally, this person will also do the data entry, which will be explained in Guide 3.